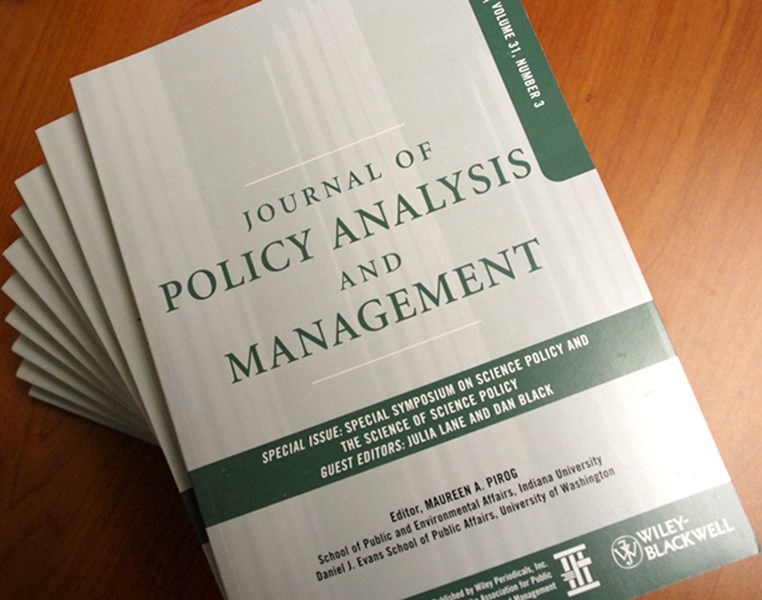
www.appam.org Association for Public Policy Analysis and Management
 
“ APPAM is dedicated to improving public policy and management by fostering excellence in research,
analysis, and education.”
  
APPAM /publications/jpam/survey00
JPAM Survey Data

APPAM and the JPAM editorial office sponsored a survey of JPAM readers in the year 2000 regarding their perceptions of the journal. The results of the survey are an important element of the report on "Assessing JPAM" prepared by JPAM editor Peter Reuter. Below are the tabulations from the survey, conducted over the Internet among a sample of APPAM members. The sample was not intended to include students since most of the questions pertained to the use of the journal by persons in their postgraduate employment.

How many JPAM issues do you read each year?-(Select One)

(N=481)

Every issue: 245 (50.9%)

Every second issue: 72 (15.0%)

No more than one a year: 86 (17.9%)

Not sure: 77 (16.0%)

Never read the journal:1 (0.2)

When do you normally read it?-(Select One)

(N=317)

When it first appears: 171 (53.9%)

I catch up on a batch every so often: 96 (30.3%)

When I need information on a particular topic that I am working on: 50 (15.8%)

Why do you not read it more often?-(Select all that apply)

(n=164)

No articles or other content directly related to professional interests: 53 (32.3%)

Doubts about the quality of the material in the journal: 5 (3.0%)

Articles are too long: 6 (3.7%)

Articles are difficult to read: 7 (4.3%)

Other reasons: 38 (23.2%)

Which sections of the journal do you usually read?-(Select all that apply)

(N=481)

Articles: 429 (89.2%)

Book Reviews: 253 (52.6%)

Curriculum and Case Notes: 127 (26.4%)

Insights: 210 (43.7%)

How important is JPAM to you as compared to other journals?-(Select One)

(N=472)

Among the three most frequently read: 201 (42.6%)

Valued but not among the three most frequently read: 212 (44.9%)

Not very important: 59 (12.5%)

Approximately how often have you cited an article from JPAM in your policy-related work, research or teaching in the last five years?-(Select One)

(n=459)

0 times: 86 (18.7%)

1-5 times: 212 (46.2%)

6-10 times: 85 (18.5%)

11-15 times: 37 (8.1%)

16-20 times: 20 (4.4%)

21+ times: 19 (4.1%)

How often have you used material from a JPAM article for teaching purposes in the last five years?-(Select One)

(n=451)

0 times: 214 (47.5%)

1-5 times: 156 (34.6%)

6-10 times: 59 (13.1%)

11-15 times: 10 (2.2%)

16-20 times: 4 (0.9%)

21+ times: 8 (1.8%)

Have you ever submitted an article for publication in JPAM?-(Select One)

(n=464)

Yes: 168 (34.9%)

No: 293 (63.1%)

Rather not say: 3 (0.6%)

If you submitted an article, was it published in JPAM?-(Select One)

(n=167)

Yes: 101 (60.5%)

No: 66 (39.5%)

Do you regard JPAM as a journal to which you would submit your best articles, if they fall within the areas covered by the journal?-(Select One)

(n=460)

Yes: 358 (77.8%)

No: 102 (22.2%)

Which topics are you most likely to read?-(Select all that apply)

(n=481)

Policy Analysis: 316 (65.7%)

Social Policy: 249 (51.8 %)

Welfare: 229 (47.6%)

Policy Implementation: 212 (44.1%)

Education: 190 (39.5%)

Housing: 176 (36.6%)

Economics: 175 (36.4%)

Public Management: 160 (33.3%)

State/Local: 159 (33.1%)

Public Finance: 139 (28.9%)

Methods: 134 (27.9%)

Health: 133 (27.7%)

Race: 123 (25.6%)

Intergovernmental: 121 (25.2%)

Employment 117 (24.3%)

Non-profit Management: 102 (21.2%)

Economic Development: 101 (21.0%)

Community Development: 99 (20.6%)

Regulation: 90 (18.7%)

Environment: 79 (16.4%)

Technology: 73 (15.2%)

Aging: 62 (12.9%)

Crime: 60 (12.5%)

Immigration: 56 (11.6%)

Telecommunications: 33 (6.9%)

Rural Policy: 32 (6.7%)

Defense: 18 (3.7%)

None: 1 (0.2%)

Which topics would you like to see more regularly covered in the journal?-(Select all that apply)

(n=481)

Aging: 18 (3.7%)

Community Development: 48 (10.0%)

Crime: 22 (4.6%)

Defense: 11 (2.3%)

Economic Development: 44 (9.2%)

Economics: 40 (8.3%)

Education: 69 (14.4%)

Employment: 29 (6.0%)

Environment: 34 (7.1%)

Health: 48 (10.0%)

Housing: 31 (6.5%)

Immigration: 25 (5.2%)

Intergovernmental: 40 (8.3%)

Methods: 64 (13.3%)

Non-profit Management: 50 (10.4%)

Policy Analysis: 98 (20.4%)

Policy Implementation: 92 (19.1%)

Public Finance: 45 (9.4%)

Public Management: 74 (15.4%)

Race: 46 (9.6%)

Regulation: 32 (6.7%)

Rural Policy: 12 (2.5%)

Social Policy: 72 (15.0%)

State/Local: 69 (14.4%)

Technology: 38 (7.9%)

Telecommunications: 17 (2.9%)

Welfare: 55 (11.4%)

None: 48 (10.0%)

Which topics do you believe receive too much space in the journal, given that the number of pages is fixed?-(Select all that apply)

(n=481)

Aging: 8 (1.7%)

Community Development: 9 (1.9%)

Crime: 3 (0.6%)

Defense: 12 (2.5%)

Economic Development: 11 (2.3%)

Economics: 46 (9.6%)

Education: 15 (3.1%)

Employment: 21 (4.4%)

Environment: 20 (4.2%)

Health: 24 (5.0%)

Housing: 16 (3.3%)

Immigration: 3 (0.6%)

Intergovernmental: 8 (1.7%)

Methods: 11 (2.3%)

Non-profit Management: 15 (3.1%)

Policy Analysis: 18 (3.7%)

Policy Implementation: 6 (1.3%)

Public Finance: 10 (2.1%)

Public Management: 29 (6.0%)

Race: 6 (1.3%)

Regulation: 19 (4.0%)

Rural Policy: 7 (1.5%)

Social Policy: 34 (7.1%)

State/Local: 9 (1.9%)

Technology: 7 (1.5%)

Telecommunications: 10 (2.1%)

Welfare: 76 (9.6%)

None: 168 (34.9%)

Are there types of articles not regularly in JPAM now which you believe belong in the journal and which you would read if they were offered?-(Select One)

(n=457)

Yes: 137 (30.0%)

No: 86 (18.8%)

Not sure: 234 (51.2%)

Would you read "practitioner oriented" articles, e.g. shorter contributions aimed at exemplifying analysis as used in the field or current management issues?-(Select One)

(n=452)

Yes: 325 (71.9%)

No: 127 (28.1%)

What do you find most appealing about the journal?-(Select all that apply)

(n=481)

Many articles related to my policy interests or research: 157 (32.6%)

High quality across range of topics: 176 (36.6%)

Articles are of a good length: 90 (18.7%)

Articles are easy to read: 54 (11.2%)

None: 10 (2.1%)

Other: 49 (10.2%)

Are there types of books by topic or methodology that you would like to see included in Book Reviews that are not regularly there now?-(Select One)

(n=456)

Yes: 55 (12.1%)

No: 134 (29.4%)

Not sure: 267 (58.6%)

Should JPAM review:-(Select One)

(n=447)

Only scholarly books: 46 (10.3%)

Scholarly books AND more popular, opinionated books on policy topics: 101 (22.6%)

Scholarly books AND books that an educated policy analyst should be aware of even if not directly useful for your work (e.g. Edward O. Wilson's Consilience or Jared Diamond's Guns, Germs and Steel): 300 (67.1%)

Would you like to see more long review essays (e.g., 5 to 8 printed pages) about several books or reports?-(Select One)

(n=433))

Yes: 245 (56.6%)

No: 188 (43.4%)

How frequently do you read the section called Curriculum and Case Notes?-(Select One)

(n=481)

Regularly: 58 (12.8%)

Occasionally: 118 (26.1%)

Infrequently: 276 (61.1%)

Have you found any articles in Curriculum and Case Notes specifically useful in your teaching or curriculum development?-(Select One)

(n=425)

Yes: 77 (18.1%)

No: 348 (81.9%)

Are there topics you would like to see receive more coverage in Curriculum and Case Notes?-(Select One)

(n=453)

Yes: 48 (10.6%)

No: 128 (28.3%)

Not sure: 277 (61.1%)

How frequently do you read the section called Insights?-(Select One)

(n=449)

Regularly: 85 (18.9%)

Occasionally: 178 (39.6%)

Infrequently: 186 (41.4%)

Do you find the section called "Books Received" useful?-(Select One)

(n=435)

Yes: 176 (40.5%)

No: 259 (59.5%)

What type of organization do you work for?-(Select One)

(n=450)

University: 271 (60.2%)

Government (other than University): 45 (10%%)

Non-profit organization: 66 (14.7%)

For-profit organization: 37 (8.2%)

Student: 2 (0.4%)

I currently do not work (retired, unemployed, etc.): 3 (0.7%)

Rather not say: 1 (0.2%)

Other: 25 (5.6%)

If you are employed by a university, are you primarily a...-(Select One)

(n=271)

University faculty member: 232 (85.6%)

University research staff: 24 (8.9%)

Other: 15 (5.5%)

If employed in government, do you work for...-(Select One)

(n=45)

Federal Government: 32 (71.1%)

State Government: 8 (17.8%)

Local Government: 5 (11.1%)

Other: 0 (0%)

If employed by a non-profit organization, are you involved primarily in...-(Select One)

(n=66)

Research: 50 (75.8%)

Consulting: 3 (4.5%)

Some other aspect of a non-profit organization: 13 (19.7%)

If you are employed in a for-profit organization, are you involved primarily in...-(Select One)

(n=37)

Research: 27 (73.0%)

Consulting: 9 (24.3%)

Some other aspect of a for-profit organization: 1 (2.7%)

Please enter your age to the nearest year:-

Average response: 45.8

Do you consider yourself primarily...-(Select One)

(n=431)

White or Caucasian: 387 (89.8%)

Black or African American: 16 (3.7%)

American Indian: 0 (0%)

Asian: 13 (3.0%)

Other: 15 (3.5%)

Do you consider yourself Hispanic or Latino?-(Select One)

(n=430)

Yes: 7 (1.6%)

No: 423 (98.4%)

Are you...-(Select One)

(n=481)

Male: 261 (59.3%)

Female: 179 (40.7%)

What is your highest educational degree received?-(Select One)

(n=447)

No degree: 0 (0%)

Bachelors (BA, BS): 12 (2.7%)

Masters (MA, MS): 59 (13.2%)

Other Professional (JD, MBA, etc.): 19 (4.3%)

PhD: 357 (79.9%)

HOME   |    ABOUT   |    AWARDS   |    CAREERS   |    CONFERENCES   |    EDUCATION   |    MEMBERSHIP   |    PUBLICATIONS   |    WHAT'S NEW

© 2008 - APPAM